
Improve your OSINT investigations into GitHub users with GHOSINT.
GHOSINT is a GitHub User OSINT Tool that leverages the powerful (and free!) GitHub API to retrieve information about a user’s actions, repositories, and their social network. In this post, we dive into the inspiration for GHOSINT, the functions of GHOSINT, as well as some use-cases that you can try as well!
How did GHOSINT come about?
In the past year, I found myself needing to perform OSINT investigations into GitHub users for a variety of reasons. While GitHub was generally sufficient for information at a glance, I ended up having to write bespoke scripts to interact with the various GitHub APIs to retrieve specific data that I needed. I also wanted to obtain and analyse data beyond what the website offered to answer questions such as:
- What does the user’s activity across GitHub look like?
- What are some identifiers that are unique to the user?
- What does the user’s network on GitHub look like?
Originally meant to be an internal tool to be shared amongst my contacts and colleagues, I realised that other researchers were almost certainly running into the same pain points as myself and could benefit from GHOSINT, hence I decided to release it free for public use at ghosint.com.
GHOSINT – how it works
Here’s a quick video on the functions available in GHOSINT.
The video above shows all the different functions available in GHOSINT. When you query a username with GHOSINT, it calls various GitHub APIs to retrieve information about the account. To reduce load on my server, all requests and calculations made are on the client / browser side, and no information is stored on the server.
The GitHub API
The GitHub API provides a lot of functionality that allows developers to build scripts and applications to automate processes or integrate into GitHub. It also provides very generous limits for free accounts, and exposes a large amount of information that you would not ordinarily be able to see via the GitHub website.
Depending on the function used, GHOSINT may make a lot of requests to the various GitHub APIs, and you will almost certainly hit requests limits with routine use. Hence, it is highly recommended to create a GitHub API key to fully utilise all the functions GHOSINT has to offer.
Creating a GitHub API key
To create a GitHub API key, follow the steps:
- Create a free GitHub account
- Navigate to Settings > Developer Settings
- Click on Personal Access Tokens > Generate New Token (Classic)
- Specify a Note and Expiry Date for the token.
- Leave all permissions / scopes empty and click Generate Token.
- Save the Token in a safe and secure place.
Congratulations, you now have your own GitHub API key! I will not go into the specifics on what the different keys are used for, however it is important to remember to treat your key like a password – kept secret and hidden from the public.
Note: As a general rule of thumb, I do not recommend entering your API key into random tools / websites, especially if they are look suspicious or untrustworthy. This is also why it is important that you left all scopes empty during the generation of the Token, so that it has minimal privileges. For additional peace of mind, set a reasonable expiry date so that even if the Token is compromised, it will still expire instead of existing indefinitely.
GHOSINT functions
This section will cover all the different functions that GHOSINT has to offer.
Profile tab
The Profile tab is always shown on the left-hand side of the site, even if you toggle between the Overview and Analysis tabs. It contains basic profile information about the user, such as:
- Username
- User ID
- Company
- Blog / other Social Media profiles
- Bio
- Profile creation date
- Profile last modified date
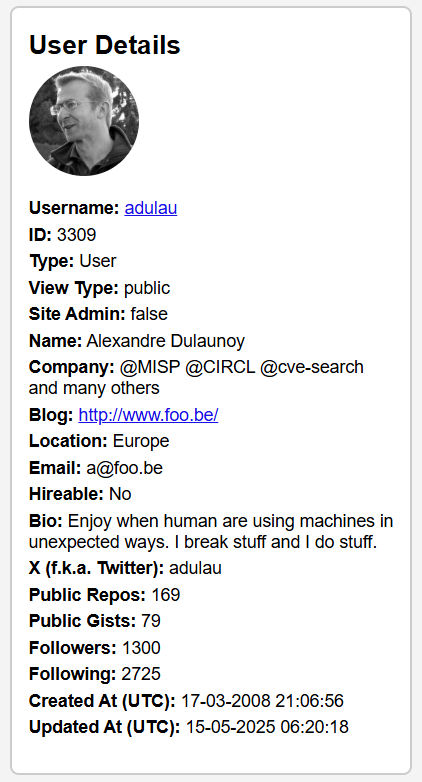
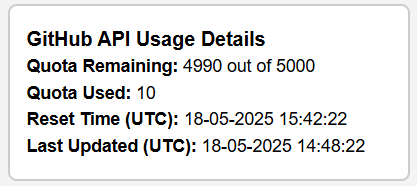
If you are using a GitHub API key, it also shows your usage details of the GitHub API.
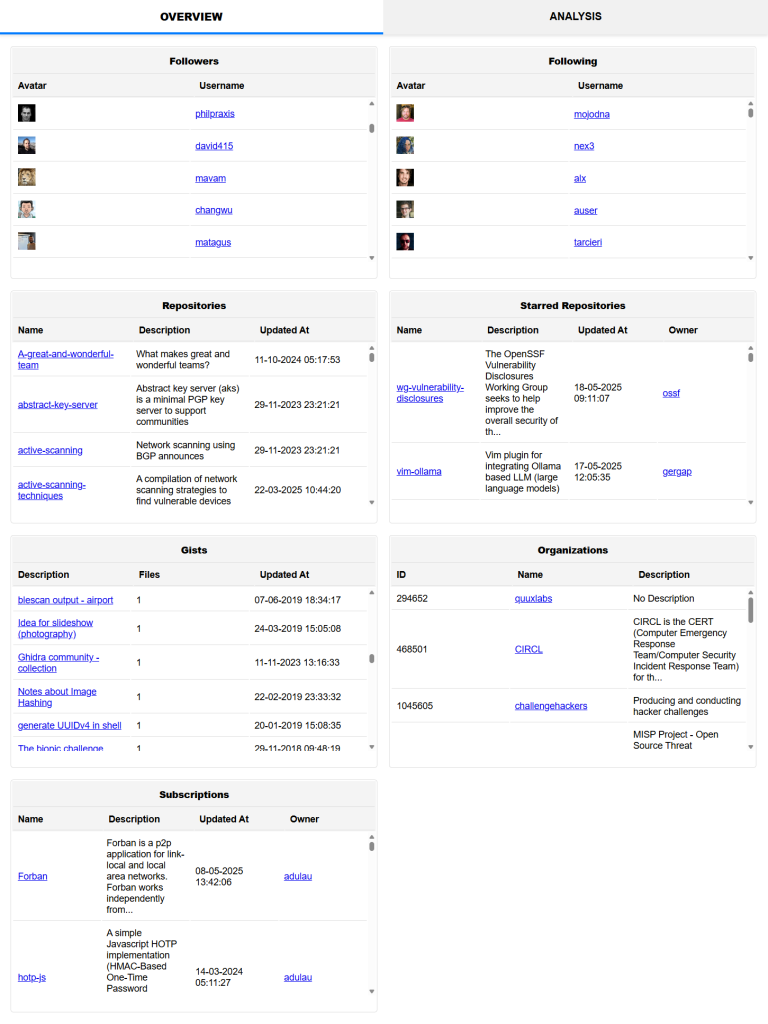
Overview tab
In the Overview tab, you get an overview of all the user’s activities on GitHub. It includes links to the user’s:
- Followers
- Following
- Repositories
- Starred Repositories
- Gists
- Organisations
- Subscriptions
Analysis tab
Within the Analysis tab, there are 5 sub-tabs that calls various GitHub APIs to retrieve data about the user’s actions, repositories, and network. It then analyses the data and presents them in different graphs to aid your OSINT efforts. The 5 sub-tabs are:
- All GitHub Events
- GitHub Events for User’s Repositories
- GitHub Events Raw Response
- User’s Repositories Commits Analysis
- Network Analysis
All GitHub Events
All GitHub Events calls the GitHub Events API and retrieves 300 of the user’s most recent public actions (Events) up to a limit of the past 90 days.
The Timeline tab displays a graph containing up to 17 kinds of Events, which can be interpreted here. The graph provides a quick overview on the user’s most recent public actions, as you can see interactions across different repositories (comments, commits etc.) and gives you an idea of what the user has been up to.
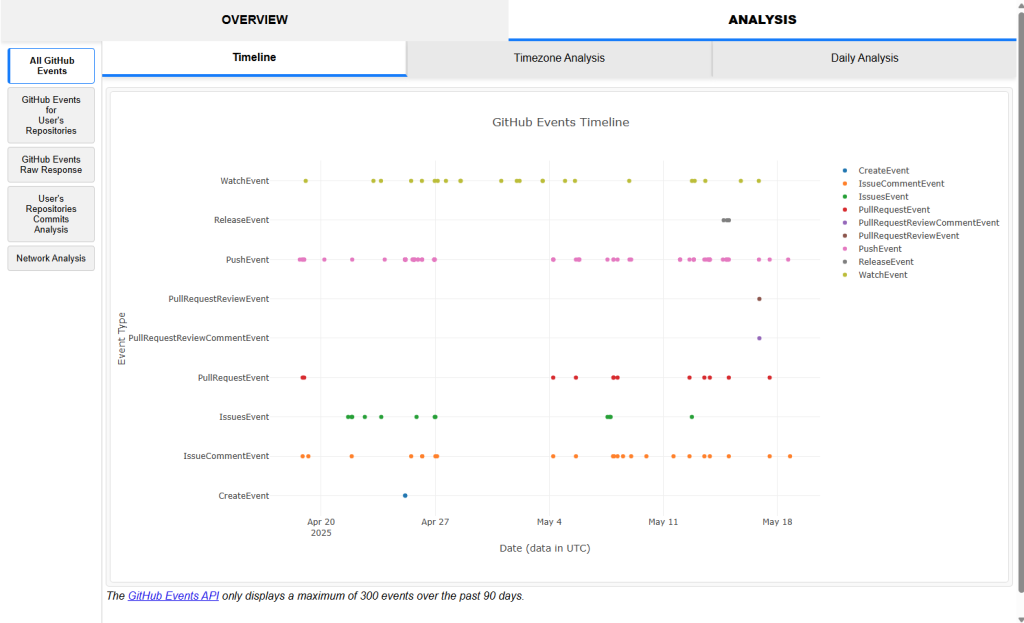
Each Event is represented by a point in the graph and shown in relation to the time where the Event occurred. Hovering over the points on the graph will reveal more information about the Event, and clicking on the point will open up a new browser tab to the relevant action / commit (if applicable). You can also click on the legend items to remove specific Events from the graph.
The Timezone Analysis and Daily Analysis tabs categorises the Events into bar graphs that represent hours of the day and days of the week respectively. They also include timezone sliders that you can use to manipulate the Event’s timestamp, allowing you to get an idea of what the user’s activity pattern would look like across different timezones.
GitHub Events for User’s Repositories
Much like the All GitHub Events tab, the GitHub Events for User’s Repositories provide an even more granular view of the user’s activity, as it is only restricted to the user’s own repositories.
GitHub Events Raw Response
The GitHub Events Raw Response tab provides the raw API response from the GitHub Events API in a json format. This is especially useful if you intend to ingest the raw response into other scripts or applications.
User’s Repositories Commits Analysis
The User’s Repositories Commits Analysis tab is used to analyse a user’s entire commit history across all their repositories (including repositories that they forked), going further back than the 90 days limit offered by the GitHub Events API. This tab also provides more information such as the commit emails used and if the commits are verified by GitHub.
The tab is broken up into 6 further sub-tabs:
- Console
- Commits
- Timeline
- Timezone Analysis
- Daily Analysis
- Language Analysis
Across all 6 sub-tabs, clicking on the flashing blue tab on the left will bring up a sidebar that contains options to filter how much and what kind of information GHOSINT retrieves from the GitHub APIs. It also contains the Analyse button that starts the process of calling the GitHub APIs.
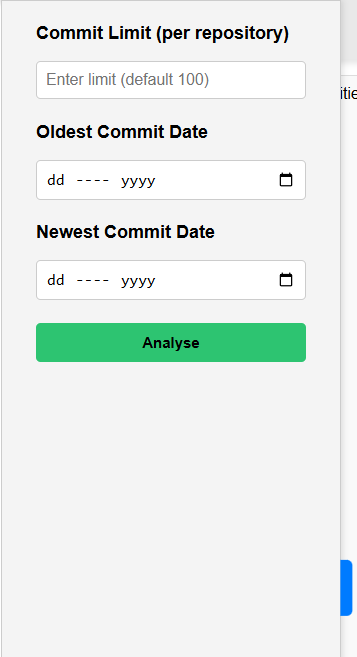
When the Analyse button is clicked, GHOSINT will begin retrieving all commit information about the user’s repositories (within the specified commit limit and date range). The progress of this retrieval can be observed in the Console tab. The speed of this process depends on the number of repositories owned by the user and commits in said repositories. The tables and graphs in the other tabs will continue to be updated in real-time as the retrieval process is underway.
In the Commits tab, you can see the details for every commit made across all the user’s repositories (up to the specified commit limit). This includes the commit time, repository name, author/committer and their email, commit message, and if the commit was verified by GitHub. Any commit whose author or committer matches the profile’s name or username will be shown in bold.
The other tabs (Timeline, Timezone Analysis and Daily Analysis) function similarly to previous tabs, except for Language Analysis, which identifies the languages used for each of the user’s repositories and forms a pie chart on the distribution of languages used.
There is also an option to filter by commits made by the user only, which will update the graphs across the Timeline, Timezone Analysis and Daily Analysis tabs to only show commits made by the user. This is especially useful to identify all commits made by a user in their own repositories.
Network Analysis
The Network Analysis tab retrieves data about the user’s followers and following on GitHub and plots them on a graph. The graph contains several functions that can be used to map out a user’s network, highlighting nodes that are mutual followers, and providing insights into a user’s social media network and interactions.
While nodes can be dragged and placed around the graph, there are pre-set layout configurations which can be selected from the sidebar to rearrange the graph automatically.
After the graph is plotted, left-clicking on a node will isolate and highlight any connected nodes. Right-clicking on a node will bring up a contextual menu with other relevant information about the profile, as well as functions to plot the node’s network or open their GitHub profile in a new tab. If you are on a mobile device, tapping and holding a node will bring up the contextual menu.
When new nodes are plotted, their colour may change depending on their relation to the other nodes, making it easier to identify nodes of interest. A legend is included at the bottom of the tab for reference.
Use Cases
While developing GHOSINT, I had several use cases that I wanted to address, but after sharing it with others, I learned that it also tackled some pain points that I did not think of before. Without delving too much into specifics, here are some potential use cases that you can consider:
- Analysing the commit history of a user who has a suspiciously large number of commits across a large number of repositories
- Identifying the region a user may be located in based on the timing of their activities
- Identifying the relationship between users to map out a social network
- Collecting identifiers/indicators made in commits by users
Final Words
Thanks for reading to the end of the post and remember to check GHOSINT out here! Beyond needing to scratch the persistent itch of developing something, GHOSINT is my way of contributing back to the infosec community. It is also the result of dozens of hours spent after work and numerous burnt weekends, but it makes me immensely proud to release something free for everyone to use.
Do reach out if you have any comments, ideas, or features you would like to see as feedback is always appreciated. Bonus points if you share examples of how you used GHOSINT or how it has helped you!
Until next time, happy hunting!
Leave a Reply